Technical analysis forex: what is it and how to use | FxPro
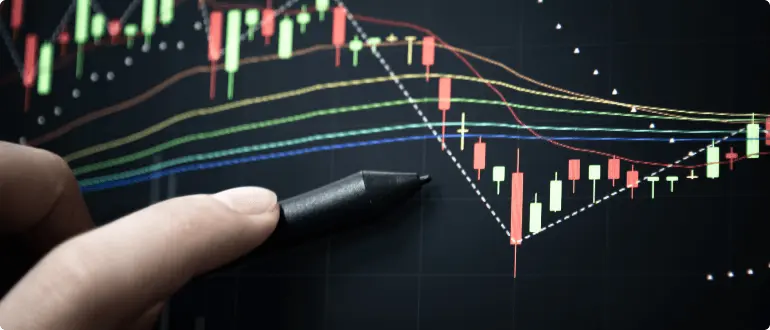
Table of Contents
- What is Technical Analysis
- Why is Technical Analysis Important
- Advantages of Technical Analysis
- Disadvantages of Technical Analysis
- Myths of Technical Trading
- Choosing best Technical Analysis Software
- Technical Analysis Charts
- Technical Analysis Indicators
- Final Word
Learning to analyze the market is vital for every trader that dreams of becoming successful in Forex. Technical analysis is one of the greatest skills that you can acquire as a new trader. In this article, we will take you through everything you need to know about technical analysis in Forex.
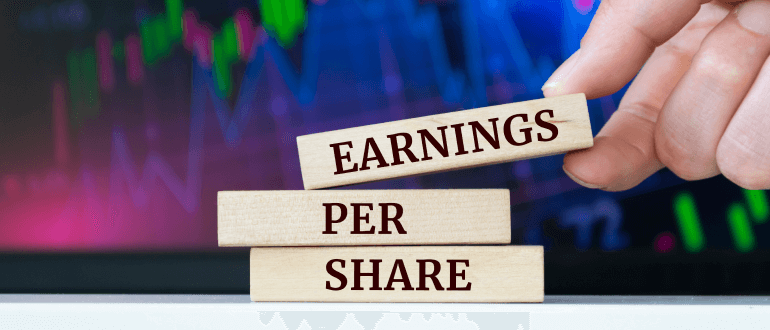
What is Technical Analysis
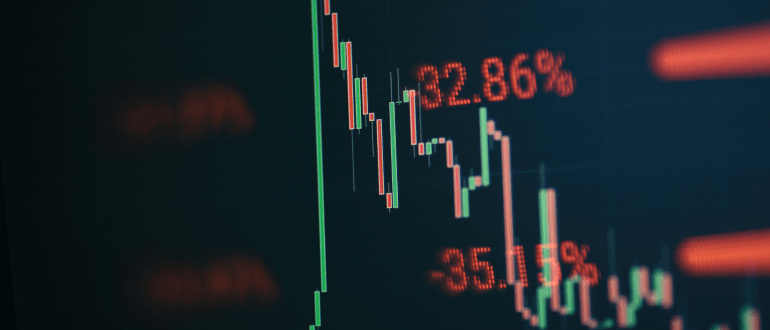
Technical analysis is a basket of strategies used to study historical chart patterns to come up with a favourable forecast of future price movements. This technique succeeds through the use of technical indicators like the moving average and other analysis tools. The theory is that markets are not random but follow certain patterns that keep re-occurring. Technical analysts argue that these patterns are usually a reflection of all the prevailing market information, and so they can be used to determine the current market behaviour. So technical analysis is simply the entire process of identifying market patterns and using them to find potentially profitable trades.
Some of the most common indicators in technical analysis are the Moving Average, Relative Strength Index, Stochastics, Fibonacci, Fractals, and Bollinger Bands. There is a section of technical traders that don’t believe in using indicators for their trading. They employ tools such as support and resistance, head and shoulder patterns, double tops, double bottoms, and individual candlestick patterns to enter the market.
Why is Technical Analysis Important
It’s easy easy to downplay the role of technical analysis in your trading, yet it's one of the most important strategies that you need to be successful. The market follows fundamental indicators such as central banks' interest rate benchmarks and gross domestic product (GDP) in the long term. However, these events do not tell you when to take a new trade or exit from your running positions. The fact that the economy is strong doesn’t mean the market will go up immediately and in a straight line. Many traders still lose their money even though their analysis was right. And soon after they have been stopped out, the market goes in the same direction they had predicted. You feel cheated when this happens to you in Forex Trading.
Warren Buffet is commonly quoted saying that if you don’t know the patsy in a poker game, then you’re the patsy.
Technical analysis keeps us from being the patsy. Studying charts with forex technical analysis strategies is the only way to get an optimal price for either going long or short. Technical traders do this by looking for some obvious patterns that have proven to be successful over the years, such as double bottoms and double tops, engulfing bars, break of support and resistance zones, and pin bars. All these help traders get a good timing for their trades and reduce chances of being stopped out or sustaining draw-downs for a long time before you get into profits. Draw-downs can throw you into a roller-coaster of emotions and mess with your psychology if they last for a very long time.
Advantages of Technical Analysis
Now that you know the role of technical analysis in your daily trading, let’s take you through the advantages of using these strategies.
- Provides all current information:- The current price and behaviour of the market is a reflection of all the known data, rumours, and emotions of traders. You don’t have to find out why the price is falling or rising, as long as your trades are in the right direction.
- Price moves in a pattern:- Forex trading would be the most difficult career if the price would be moving randomly. Luckily, that is not the case. A keen look at any historical price chart will reveal to you some common trends that usually end up with the same outcome every time they occur. For example, the price explodes whenever it breaks a key support or resistance zone. Traders can take advantage of such simple concepts to place trades.
- Ideal entries:- Trading is exciting when you learn to pick sniper trades that shoot into profit almost as soon as you jump in. Proper timing for your trades is also a risk management strategy. The smaller your stop-loss, the better your risk-reward ratio.
- They work on any market:- Technical trading is one giant field that you can apply in any market. You can trade forex, stocks, indices and futures etc., using the same technical analysis skills. The reason is that prices in all markets factor in fundamentals, as well as human psychology. Additionally, these strategies work across all time frames, giving you flexibility. Technical patterns don’t change; they are the same across all markets and time frames.
Disadvantages of Technical Analysis
So much good information about technical analysis doesn’t make it a crystal ball. There are some limitations of this strategy that you need to know.
- Invalid for long term traders:- Technical analysis does not hold water in the long term. The market keeps changing, and so your analysis can be thrown out of the trend at any time. That’s why long-term traders such as position traders stick to fundamental analysis.
- Uncertainty:- The biggest challenge of technical analysis in Forex is uncertainty. There are many instances when commonly occurring patterns fail to follow the norm. A trader that purely relies on technical trading is always unsure of whether the market is going up or down. They only rely on high probability patterns, which sometimes fail even two or three times in a row. Having some little fundamental knowledge can help increase the accuracy of a technical trader.
Myths of Technical Trading
- Only for Retail Traders:- The common myth about technical trading is that it is only used by retail traders. That is wrong. Big institutions like hedge funds use technical analysis too. Some of these strategies existed long before retail trading was allowed. Algo and high-frequency trading also rely on technical analysis to a large extent.
- Low Success Rate:- Some traders argue that technical analysis has a low success rate and urge traders to spend more time on fundamental trading. You need to know that forex trading is like an art. It’s all about mastering your entries and exits, then adding some risk management to that. Numerous respected investors have made a fortune from technical trading. One of them is Steve Sykes, who grew $12,000 to over $1.6 million while in college.
- Technical Analysis is easy:- There is nothing easy or hard in Forex. Just like any other industry, your commitment goes a long way in determining how successful you can get. While technical analysis is not as cumbersome as fundamental trading, it still takes a proper mastery of your skills to be a profitable technical forex trader.
Choosing best Technical Analysis Software
Choosing the best technical software can get your head spinning if you lack proper guidance. There are two main factors that you should always look at while selecting a technical analysis indicator.
First, proven results. You want to use an indicator that will help you to be successful in the market. So carry out some research to find out how well an indicator performs before adopting it. We always say that past trading performance is not an indication of the future, but it still helps to gain confidence in your strategy.
Second, only pick a software after you are sure there is readily available material that you can use to educate yourself on the best strategies for trading with that technical analysis software.
Technical Analysis Charts
There are three main technical analysis charts that you can use for your trading.
Line charts
Line charts simply plot the closing prices or trading periods and connect them to give us a neat line graph. They have less information hence mostly used when making a presentation that doesn’t need details. Rarely do traders use line charts to take positions in the market.
See below.
Bar charts
Bar charts display more information than line charts. They give us the high, low closing price, opening price, and trading range for each period. Some traders prefer using bar charts in their chart analysis. See the chart below.
Candlestick charts
Candlesticks and bar charts are similar in every other way, only that candlestick charts are more visible and appealing to the eyes. Most traders find them best for chart analysis due to their visual appeal and easy readability. See the chart below.
Technical Analysis Indicators
There are hundreds of technical tools that you can deploy in your trading. Those that come with your brokers' trading platforms are called default indicators. They give you the first experience of technical analysis when you are new to forex trading. Here are the most common technical analysis tools that traders use:
- Moving Average (MA)
- Relative Strength Index (RSI)
- Stochastic Oscillator
- Moving Average Convergence Divergence (MACD)
- Bollinger Bands
- Fibonacci Retracement
- Fractals
Final Word
Technical analysis is an important part of short-term trading. Newbies can start by learning about forex technical analysis strategies before they dive into the more complex world of fundamental trading. In the end, investors usually always use a mix of both technical and fundamental analysis to increase their success in trading.

practising?