What is a timeframe in simple words, what types there are and what is better to choose for trading
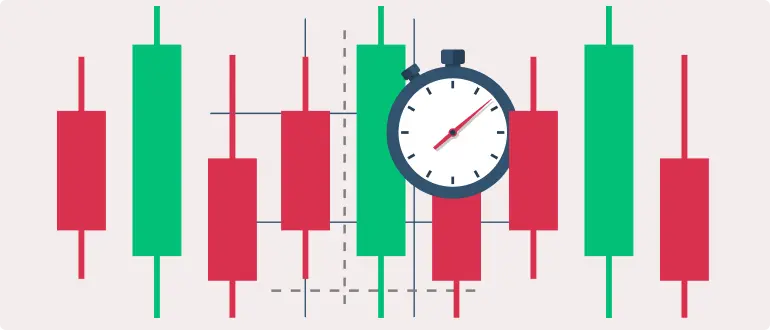
Table of Contents
- What is a timeframe?
- What timeframes there are
- Which timeframe to choose for trading
- Scalpers
- Day traders
- Short-term
- Long-term
- Which timeframe is better for intraday trading
- Technical analysis
- Graphical analysis
- Fundamental analysis
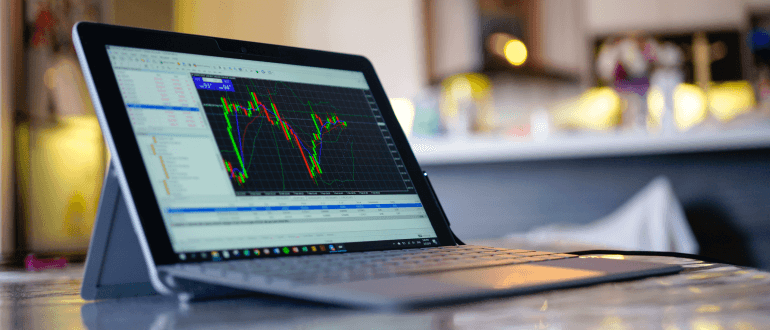
When you open a chart, you probably don't think about the fact that the trends you see on it depend entirely on the selected timeframe. That is, if you switch between time frame tabs, you will see completely different charts, different support-resistance levels and different signals to open trades.
Some traders may think that this way they want to confuse them. Others - that you just need to choose the timeframe, which displays a favourable trend for you. Others - that all this is meaningless, and you should periodically switch between the tabs of timeframes, trying to catch the elusive trend. In fact, both are partly right.
What is a timeframe?
A timeframe in trading is your coordinate system. It is the reference point on which you will be guided when making decisions, from setting indicators and receiving signals from them, to determining the figures of graphical analysis and trends "by eye".
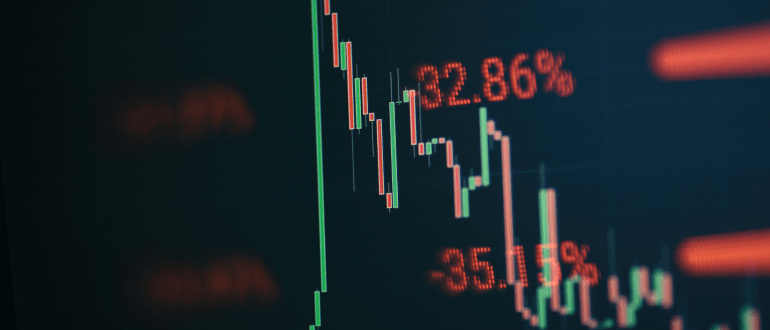
In simple words, a time frame shows a chart in a certain time scale. Most often when using it, it includes a method of displaying price in the form of Japanese candlesticks. So, each Japanese candlestick contains the result of trading for a period equal to the selected time frame. For example, if you have an open "hour" chart (H1), then each candle - green or red - on this time frame will be equal to one hour. That is, it will show how the price behaved during these 60 minutes. If at the moment of finishing an hour the quotation of the asset was lower than it was before, the candle will be coloured red. If on the contrary, it ended the hour higher than it started, it will be coloured in green.
What timeframes there are
It turns out that the time frame is the effective scale of the chart, and the trend on a certain time frame is valid only on it. It is enough to switch the period - and this situational trend is gone. So it turns out that traders think that now it is necessary to "Actively buy", but in fact, if you open a more "senior" time-frame, it is necessary to "Actively sell".
The name of the time frame consists of two elements: a letter code and a numeric code. They are decoded very simply: M - Minutes, H - Hours, D - Days, W - Weeks, MN - Months. Accordingly, on M20 each candle equals 20 minutes, on D - each candle equals one day, on H4 - four hours.
Which timeframe to choose for trading
The smallest - they say, the "junior" timeframe - is M1, the minute chart. It changes most sharply and shows even the smallest price fluctuations, collecting all the "market noise". It is not recommended to trade on it, as it does not show the real market picture - really only confusing traders. Even if you want to trade using a scalping strategy, it is better to start analysing the chart at least from a period of five minutes - M5. There are also 10, 15 and 20-minute charts. They are optimally suited for intraday trading. 30 and 60-minute timeframes are the choice of those who open deals in the section of one or two days.
H2 and H4 are usually traded by those who open deals for a week. D, W are the choice of medium-term traders who are ready to wait for a successful result on a position for a couple of months, and MN is used by investors who open a deal for a year or more.
What type you belong to, let's find out now.
Scalpers
So, if you make hundreds of almost non-stop trades a day, trying to catch the smallest price movements and trying to take the profit you can grab in 5-10 minutes, then you are a scalper. You need appropriate timeframes: the more fractional they are, the better, in fact.
Let's say right away that this is a very nervous type of trading, given that each deal is initially opened in the minus on the size of the spread, and to predict the price movements within a few minutes is not possible by any indicators. Cold head and luck are your only tools in the struggle for conquering the market noise. In this case, choose the chart scale from 1 to 10 minutes (M1-M10). You should analyse each of them to avoid getting into a mess by opening a scalper deal against a strong trend, which will take your deal with you in the opposite direction. By the way, margin trading for a scalper is an additional strong risk. If you still like this style of making deals, it is better to trade "on your own", and at the same time open no more than two deals for a total amount of up to 10% of the balance. In this case, if things do not go according to plan, you will have enough time to wait for the chart to turn in your direction.
Day traders
Intraday traders should first of all analyse charts with timeframes from M20 to H4. The older periods will help to see the picture of the day as a whole, and the younger ones will give clues in time about the possible emergence of a change of trend. By the way, each timeframe requires its own indicators, because the support and resistance levels set on H2 will most likely not even be visible on M30.
In order not to move lines and not to get confused, it is optimal to go through all the charts, assess the situation and stop at the end on some one. You can analyse it and use it to guide you when to close a deal. Most likely, for you it will be M30 or M60, depending on how many hours you set a position for: yes, you should also have a plan for this.
Short-term
Ready to wait for the result of a trade for days on end? Then choose a longer timeframe. Your option is D or W. In the first case, each candle will indicate the price change for a day (24 hours), and in the second case - for a trading week (from Monday morning to Friday night). On weekends, as you know, the markets are closed. I must say that the day period is the most stable of all. It does not include unnecessary market noise and intraday volatility, showing the trend of each particular day. It is on it that you will have to trade.
Long-term
In fact, for long-term trades of a few months or more, it is important to initially go through all timeframes, read analytics from global agencies like Morgan Stanley, go through the news feed to identify this year's favourites, and study the company you are going to invest in. Unless, of course, you decide to buy long term in, say, gold or currencies. It is important to understand why you assume that this asset will grow (whether there are preconditions for this in the general news background, in the company's reports and plans, in news and rumours). For the year ahead, the timeframe doesn't really matter, because everything can change at any minute: a disappointing quarterly report is published, or, say, investors decide to shift their capital from gold to risky stocks, and so on.
You should be ready for flexible decisions, or you should have a firm character, having chosen a "Buy and Hold" strategy. In this case, it is better not to open the trading platform every five minutes in the hope of fabulous profits or a change in the situation. As you remember, you are not interested in what is happening now, but what will happen to the asset a year from now. However, you should definitely take a look at the D, W and MN timeframes. To at least understand what asset you are dealing with, how overvalued it is, and what historical peaks or lows the price has reached.
Which timeframe is better for intraday trading
Now - the most important thing. How to analyse the chart on the chosen timeframe? The question is very extensive, let's run in this article literally on the top.
First of all, you need to have all 4 types of market analysis in your arsenal. Even if you choose only one of them, it is extremely useful to have the others in your arsenal.
Technical analysis
You should have a strategy, which includes getting buy or sell signals from different indicators. Of course, you should select them in advance. As a rule, traders use support and resistance levels, plus two or three more tools. These can be two moving averages with different periods (slow and fast) - they will give a signal when they cross each other - as well as some oscillator that appears under the chart and confirms the signal. Most often Stochastic, MACD, etc. are chosen.
In this case, the indicators show the change of the current trend to a new one, and the oscillator shows the depletion of the strength of the old trend (based on trading volumes). Of course, all this is shown within the specific time period you have chosen. Support-resistance levels act as boundaries that allow you to assess the expected chart movement.
In order not to build such a "tower" of indicators several times, use one "working" time frame and one - the test one. Usually, the younger one (for example, M30) and the older one (for example, H4) are taken as a basis to control the general trend.
If you do not take the issue of preparatory analytics seriously, your speculative trades "for a couple of minutes" can easily grow into positions for several days. So, it is strongly not recommended to neglect technical analysis.
Graphical analysis
It is based on the search for reversal figures and trend continuation patterns on the Japanese candlestick chart. It is an interesting practice that is also called Price Action, i.e. analytics based on price movement. When you develop an eye and quickly see at least basic patterns on the chart, you will be able to find them on timeframes of different sizes. This will help you decide on which timeframe you will open a trade for this time. If, in your opinion, a clear "Flag" is formed on the H4 chart, and you understand how to proceed, then stay on this time frame, set indicators and oscillator, get a confirming signal and open a deal based on this price movement. In this case, it is not so important to you what happens on the M5 timeframe: you are oriented on the fact that your trade can be opened for several days, until the received graphical (and technical) signal is lost. Be flexible in your decisions: it is important to be a trader, and whether you are a short-term or medium-term trader is a matter of convention.
Fundamental analysis
On all timeframes from M1 to H4 it is pointless to start trading without looking at the Economic Calendar. You should clearly understand that the publication of any report will not interfere with your plans and analysis of historical data, which is so fond of being cited as an example in trading textbooks. Opening a trade 5 minutes before the release of Nonfarm Payrolls, without taking them into account, at the very least, is simply stupid. A sharp price movement at the moment of publication can completely change the balance of power on the chart, changing the focus of interest of traders around the world for a few days. After all, the price can both return to the previous range and consolidate at completely new levels, without hurrying to return to the harbour you have calculated.
Of course, if you are focused on the D, W and MN periods, then the release of any macroeconomic news is a situational drop in the sea, and there is no sense in being orientated on them. During the time your position will be in the market, these data will be released a dozen or even more.
But if you trade intraday (M10-H4), you should know what is planned to be published today. Besides, if you have chosen to trade shares, be sure to check the Dividend Calendar on the FxPro website to find out when the dividends are planned to be paid. It is also important to clarify the date of the nearest company report: the price usually changes a lot a few days before the publication (on expectations) and a few days after. Now you know how to choose the timeframe according to your trading style and analyse the market competently!

like a Pro, with the
FxPro App