Ichimoku Kinko Hyo Indicator: what is it, how to read it, how to use in trading

Table of Contents
- What is the Ichimoku Indicator?
- Components of the Ichimoku Kinko Hyo Indicator
- The Cloud
- Fast Line
- Slow Line
- Delay Line
- Advantages and disadvantages of the Ichimoku indicator
- Using Ichimoku Kinko Hyo Indicator in MT4 and other platforms
- How to read Ichimoku Kinko Hyo indicator
- Ichimoku Forex Trading Strategies
- Ichimoku cloud strategy for trends
- Strategy using Kijou and Tenkan lines
- Using it as a guide for Stop Loss’s exiting a trade
- Using Ichimoku with Other Indicators
- Ichimoku kinko hyo best settings, instruments and time frames
- ichimoku kinko hyo in conclusion
In this article, we will explain the logic behind the Ichimoku Kinko Hyo indicator, also known as Ichimoku cloud, its components, and how you can utilise the indicator in your trading strategy.
This is often considered a highly complex looking indicator. However, once you take a deep dive into how it works, the overall picture will become clear. You will be able to read, understand, and act on its various trading signals and market analysis.
What is the Ichimoku Indicator?
The Ichimoku Kinko Hyo is a momentum and trend indicator created by Japanese journalist Goichi Hosoda back in the 1930s. However, he spent another 30 years developing the technique, and it was not released to the public until the 1960s.
The name Ichimoku Kinko Hyo (目均衡表 in Japanese) can be translated into English as 'instant look at the balance chart'. Overall it helps provide more accurate candlestick pricing.
This seems ironic when you look at a chart with it applied for the first time. There are lots of lines and colours that appear to clutter the chart and cause confusion to some. However, once you learn to understand each component and recognise its signals, it provides a wealth of useful information to assist you with your trading and is simple to interpret.
The indicator's unique feature is the 'cloud', also known as the 'Kumo'.
The Ichimoku is built on several moving averages; however, instead of being based on the candlestick closing price like a regular moving average, they are applied to 50% of the high – low price.
Five lines in total make up the indicator, two of which form the 'cloud' area, predicting future support & resistance levels. The indicator also gives signals for buying and selling, as explained below.
Components of the Ichimoku Kinko Hyo Indicator
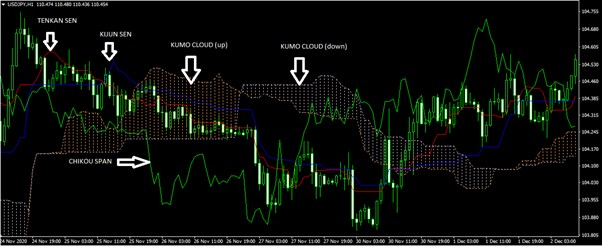
The indicator is composed of five lines: tenkan-sen, kijun-sen, senkou span A, senkou span B and chikou span.
The Cloud
The Kumo or 'cloud' is formed by combining senkou span A and senkou span B and helps to identify trends. The space between these two lines is partially coloured in. If the senkou span A forms the top of the cloud, it is considered bullish. When the senkou span B forms the top of the cloud, it is considered bearish. When the price is within this cloud, it means the market is ranging, i.e. not trending.
Fast Line
The tenkan-sen is the faster line, otherwise known as the conversion or signal line, and it indicates price volatility. Calculated over 9 periods, it sums together the highest high and lowest low, which is then divided by 2. This line can be used as a signal line for potential trend reversals or to act as support and resistance. It is usually red in colour.
Slow Line
The kijun-sen is the slower blue coloured line indicating long-term price volatility. Also known as confirmation line or baseline. It is calculated over the last 26 periods and sums together the highest high and lowest low, divided by 2. As well as confirming trend changes and representing support and resistance levels, it can also be used to set a trailing stop loss. It is essentially the same as the Tenkan but used over a much longer time period, making it slower to react, hence why it is often called the slow or lagging line.
Delay Line
The chikou span, or delay line, represents closing prices for the previous 26 periods of price movement and is used to confirm trends from other lines. It is usually a green line and is also known as the lagging span. You can see each specific line labelled on the Ichimoku forex chart below:
Advantages and disadvantages of the Ichimoku indicator
The main benefit of the Ichimoku indicator is its ability to give an overall picture of the market at just a glance, indicating the momentum, trend direction and strength of the trend.
It gives a much more detailed image of the price movements than regular candlestick charts alone.
Another big advantage is that it can help to determine future support and resistance levels, whereas most indicators provide support and resistance on current and historical prices only.
The indicator works best in a trending market and doesn't provide much help in ranging markets, i.e. when the market is trading sideways.
However, one positive of this is that it identifies when a trend is absent, and therefore it is not a good time to trade, and you should wait for a trend signal to appear.
An important point to note is that you should trade in the direction of the trend and never against it when using this indicator.
Using Ichimoku Kinko Hyo Indicator in MT4 and other platforms
The ichimoku kinko hyo forex indicator is available as default in the Indicators list of Metratrader 4, Metatrader 5, cTrader and the FxPro edge webtrader.
The default values are as follows:
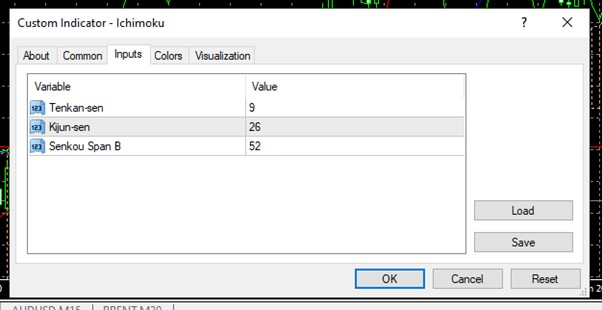
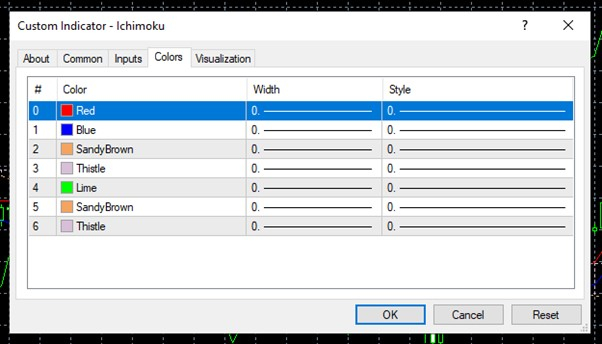
However, you can edit the settings according to your preferences and can also adjust the colours of the various lines and their thickness as needed:
It is also available in the MT5/MT5 and cTrader mobile applications.
How to read Ichimoku Kinko Hyo indicator
Before we delve into some of the strategies you can use to trade with Ichimoku, lets run through its main signals:
- If the Chikou span line crosses the price chart from the bottom up, it is a buy signal.
- If the Chikou span line crosses the price chart from the top down, it is a sell signal.
- When the price is above the cloud, the upper line of the cloud represents the first support level, and the lower line represents the second support level.
- When the price is below the cloud, the lower line of the cloud represents the first resistance level, and the upper line of the cloud represents the second resistance level.
- If the price is within the cloud boundaries, then the lines represent support and resistance.
Ichimoku Forex Trading Strategies
Because Ichimoku is so complex and combines several different theories and indicators, there is a number of different forex strategies that can be formed based on it.
Ichimoku cloud strategy for trends
Here is how the indicator looks applied to a Daily USDJPY chart:
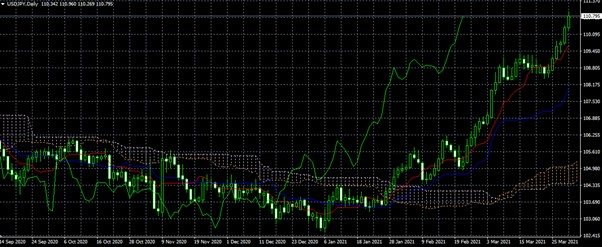
As you can see, when the price broke above the cloud, a long uptrend developed.
When the price fell below the cloud boundaries, a steady downtrend continued.
The tenkan-sen (red line) indicates a current trend by rising or falling. When it is flat or moving sideways, no trend currently exists.
The kijun-sen (blue line) signifies momentum. If the price is above or below this line, it will most likely continue in the same direction. If the price crosses this line, it is potentially a change in trend in direction.
The height of the cloud is related to volatility. The thicker the cloud is, the more volatile the price swings and the stronger the support and resistance levels are. If the cloud is thin, prices may tend to break through it, and the support and resistance offered by the outer edges will be weaker.
The clouds angle indicates if the trend is bullish or bearish. When span A crosses above span B, it is an uptrend and vice versa for a downtrend. The trend is further strengthened if the price is moving in the same direction as the cloud. I.e. if the cloud is bullish and the prices are also above the cloud, then this is a strong uptrend. If the cloud is bearish and the prices are also below the cloud, this indicates a strong downtrend. When the price is behind the cloud, it is known as a shadow.
Strategy using Kijou and Tenkan lines
Another popular strategy is based on the crossover between tenkan-sen (red signal line) and Kijou (blue base line).
- When the price is above the cloud and the signal line crosses above the base line, it is a strong buy signal.
- When the price is below the cloud and the signal line crosses below the base line, it is a strong sell signal.
In this strategy, it is suggested to hold the trade until the lines cross back over each other or use any of the other relevant support and resistance lines as a level to close your trade.
Using it as a guide for Stop Loss’s exiting a trade
Many traders use the Ichimoku as a guide for where to place stop losses, or exit the trade.
Stop losses or trailing stops can be placed at the first support level, which keeps losses relatively small, or you can use the second level for a wider price range.
After a breakout forming a new strong trend, you can place the stop loss below the breakout candle and trail a stop loss above or below the cloud (depending on the trend direction) or close the trade once a new crossover occurs.
It is best to practice using the indicator in a demo account to determine which specific strategy works best for you.
Using Ichimoku with Other Indicators
Although the aim of Ichimoku is to be an all-in-one indicator, it often works best in conjunction with other indicators and technical analysis. It is often used in combination with the RSI (relative strength index), which can help to confirm the direction of the trend. Another option is to confirm the strength of the trend using the Momentum Indicator. Both of these indicators are available as standard on all FxPro desktop platforms.
Using another indicator alongside it also helps to filter out false signals. For example, the market may be in a strong uptrend, but you may see the price momentarily fall into the cloud and assume the trend is reversing or coming to an end. However, you may simply be witnessing a short term price fluctuation within a bigger trend. Using a secondary indicator can help you confirm what you are seeing and whether it is a relevant signal or not.
Ichimoku kinko hyo best settings, instruments and time frames
Although it tends to work best with daily or weekly charts of JPY pairs, this indicator can be applied to any market and time frame. Including Forex, Commodities, Stocks, indices etc.
However, it is important to decide on the specific time frame(s) appropriate to you, depending on whether you are a short term, long term or intraday trader. For example, if you are trading over several hours or days, looking at the Ichimoku on a 1-minute chart is pointless as you are going to see several movements that contradict the longer-term trend.
However, if you are a scalper, you will want to use the 1minute chart for signals to open and close positions and the 5-minute or 15-minute charts to determine support and resistance levels.
The ichimoku kinko hyo best settings to use are the default values:
Tenkan-sen: 9
Kijun-sen: 26
Senkou span B: 52
The number of periods above refers to the number of previous candles price data used to calculate each moving average line.Some traders may even change the settings to hide certain lines that are not relevant to them or keep only the cloud to avoid chart clutter.
ichimoku kinko hyo in conclusion
Although Ichimoku looks rather complicated at first, once you learn to understand its patterns, it can be very useful, combining several indicators to form an overall picture of the market at a glance. Now that we have explained how it works, you can decide if this sounds like something you may wish to implement into your trading strategy. If so, we would suggest practising, observing and trading with the indicator in a risk-free FxPro demo account environment.

world’s #1 broker
awards